Dashboards
Project (Fleet) Dashboards
Our highest level dashboard is a Project dashboard which allows you to have a view of your entire fleet. You can have an overview of your fleet like in our Custom Widget (Robot List) or you can add key telemetry for individual robots on the same dashboard. With our custom widget you can also display information from other systems you use to get a complete picture of your operations.
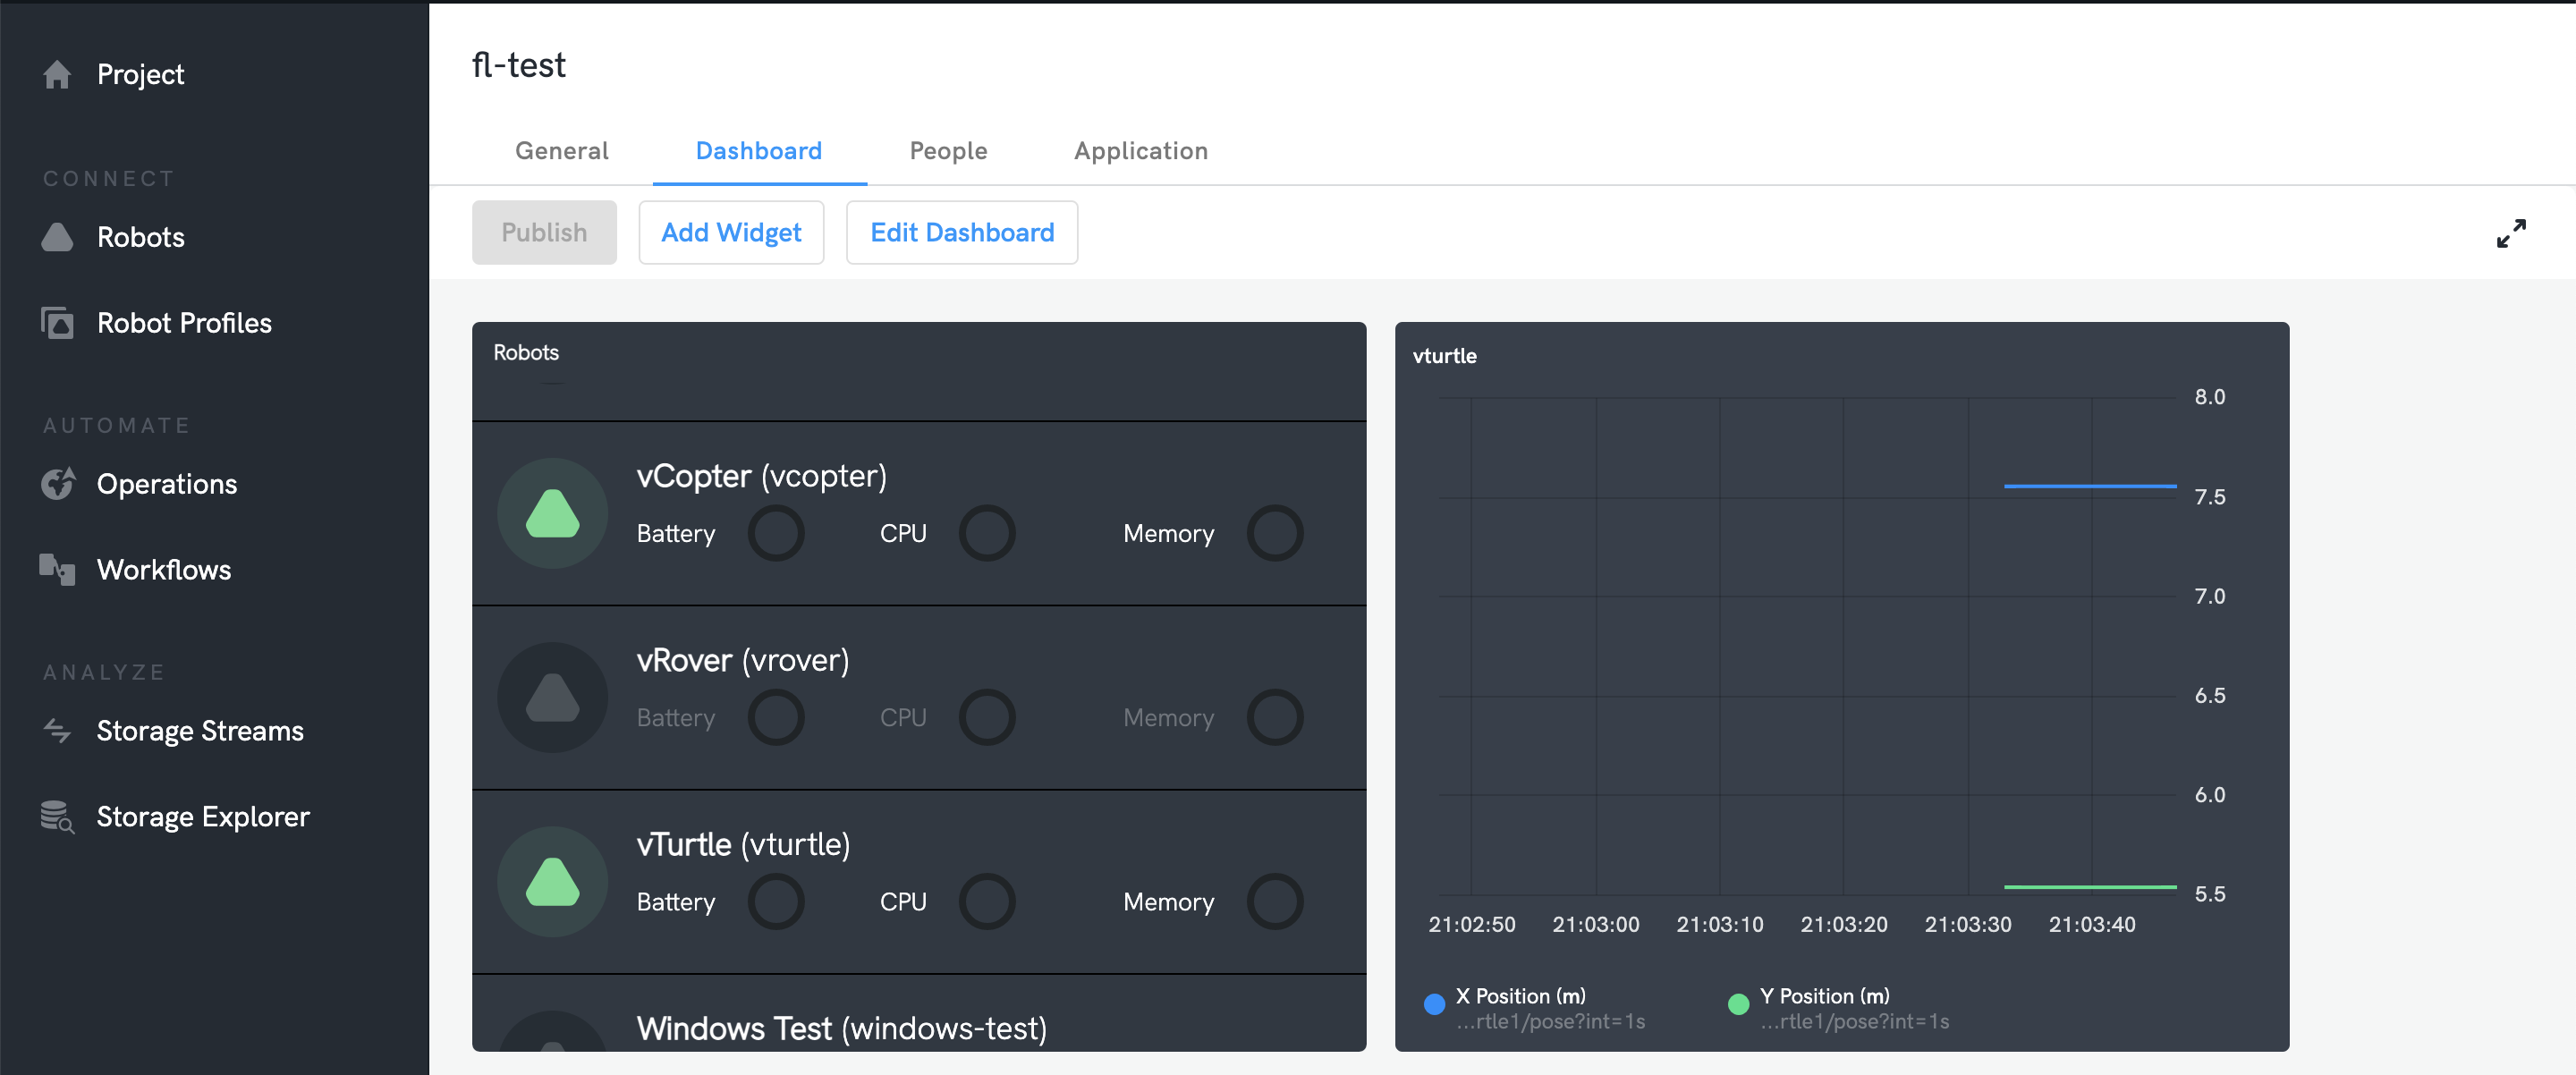
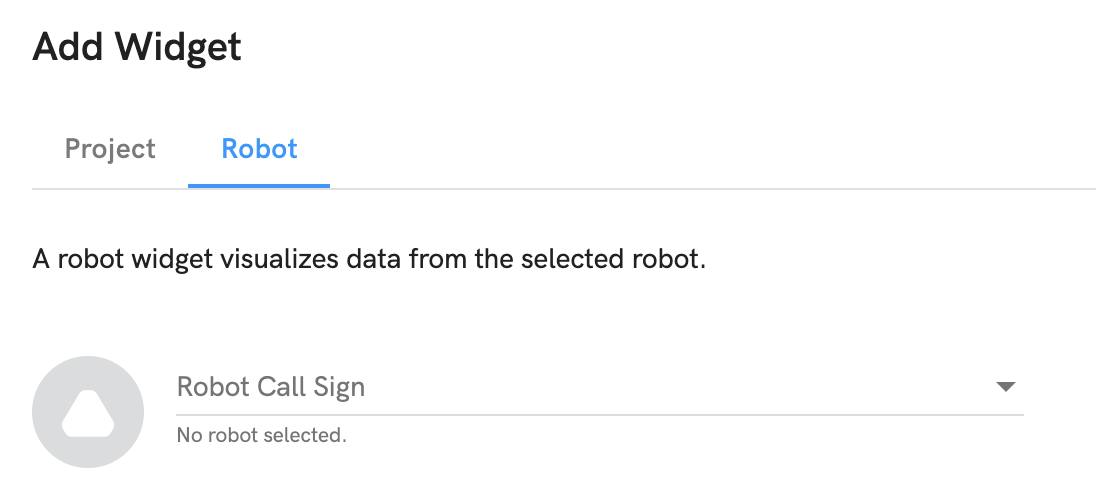
You can add a Project or Robot widget to your Project Dashboard. The Robot Widget allows you to select a certain robot and then the widget will have the robot name in the title. The Project widget can be custom to combine your robot and operation data all on one dashboard.
Visualize Your Robots' Data
Dashboards (along with Commands and Buttons) can either be added directly to a robot, or via its Profile. Dashboards added to a robot will only appear for that robot. Dashboards added to the Robot Profile will be added to all robots that are assigned to that profile definition.
The dashboard uses widgets to visualize live data from your robot. Widgets are bound to data values through Data URIs which are used to identify the specific level of telemetry data you want to display. See Exploring Data on your Robot for more information on subscribing to Robot topics.
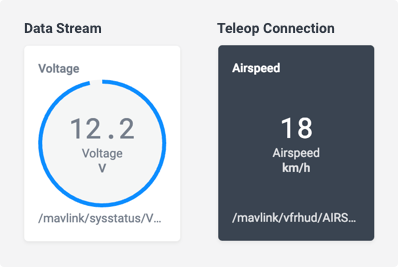
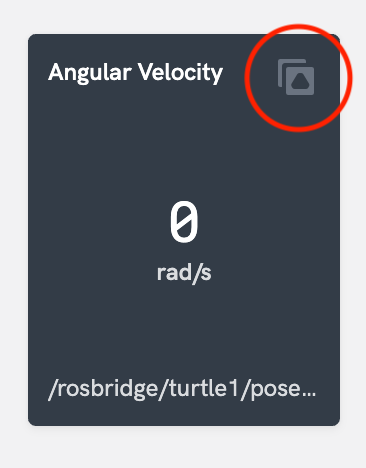
Widgets can be bound to either a Data Stream (stored telemetry data with a set sample rate) or a Teleop Connection (a live subscription to the robot). These widgets can be distinguished by their background color as shown below. See Streaming Data for more information on Teleop Connections and Data Streams.
Components which are defined within a Robot Profile are only editable via the profile and are denoted by the Robot Profile icon.
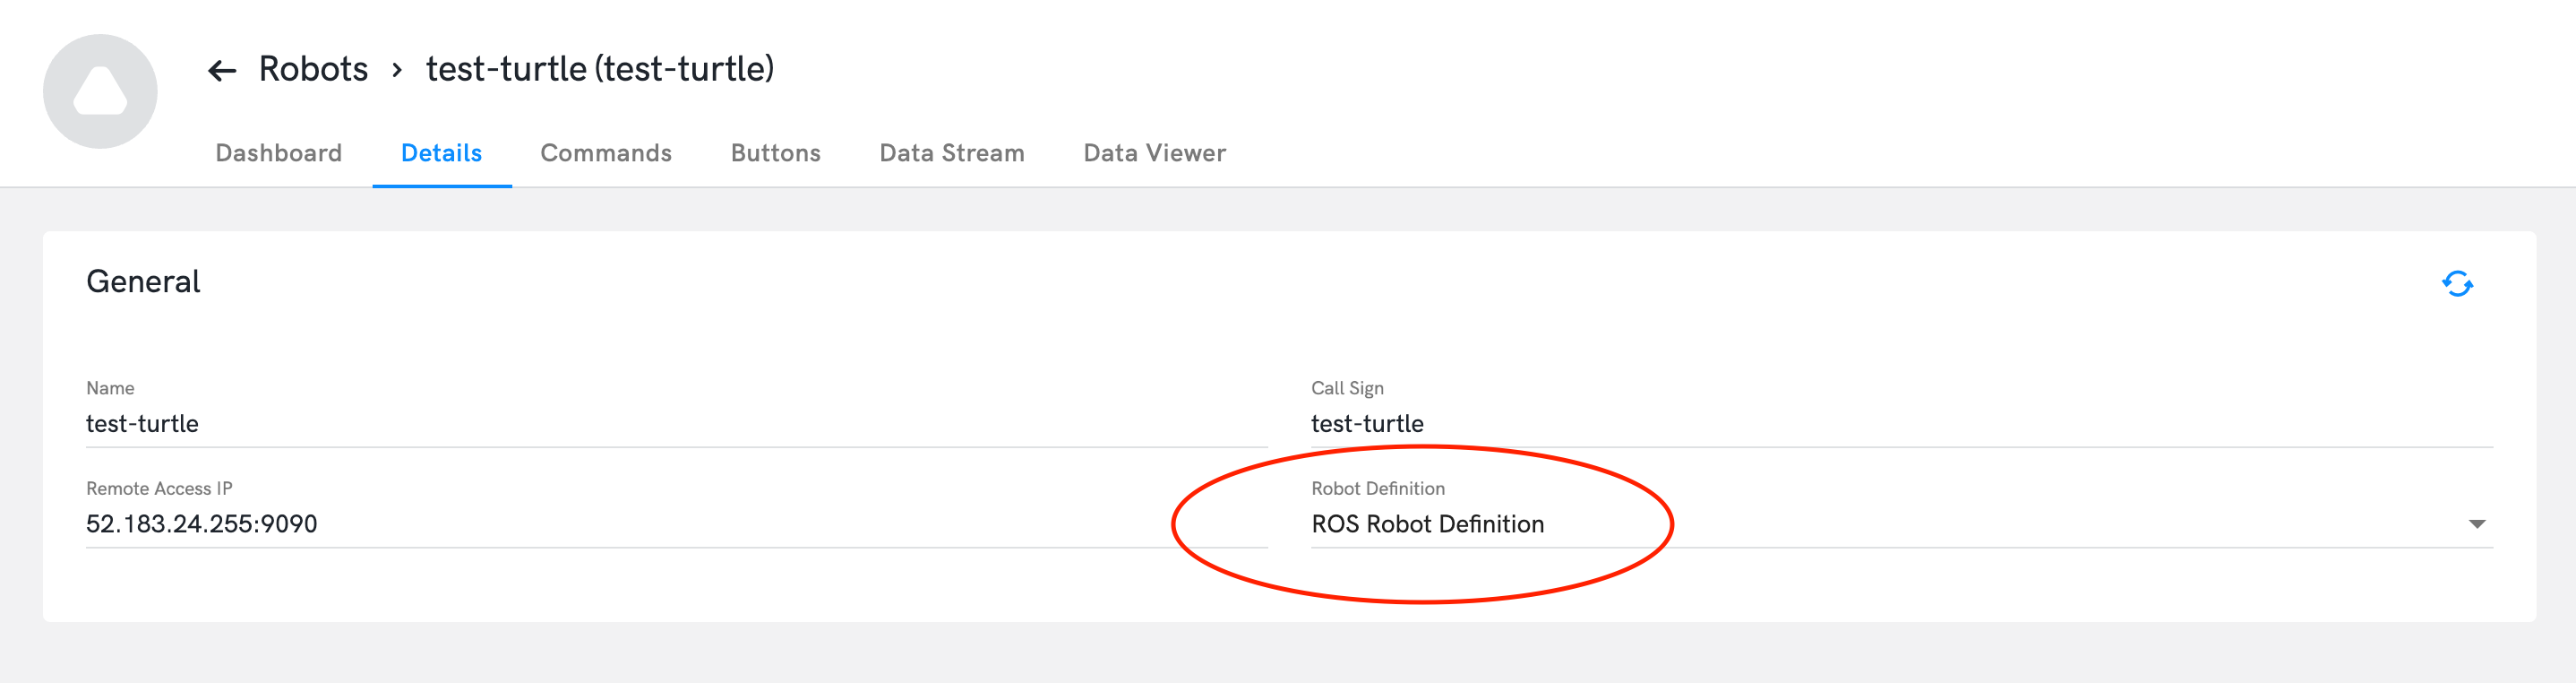
To see what profile a robot is using, click on the robots 'Details' tab within the robot screen. See Robot Profiles for more information.
Multi-layer Dashboards
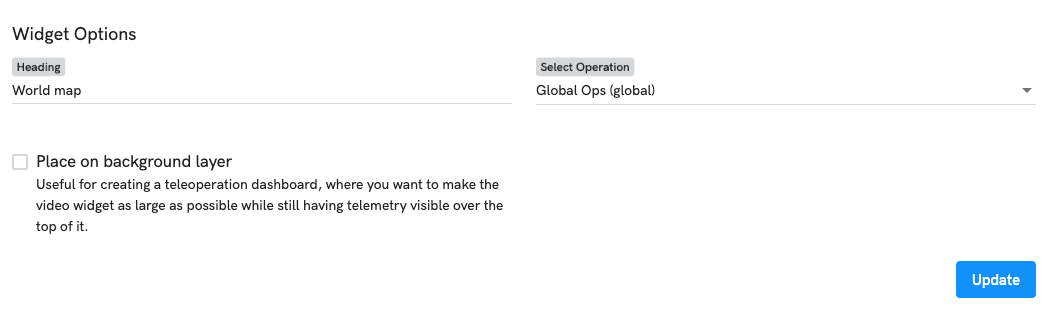
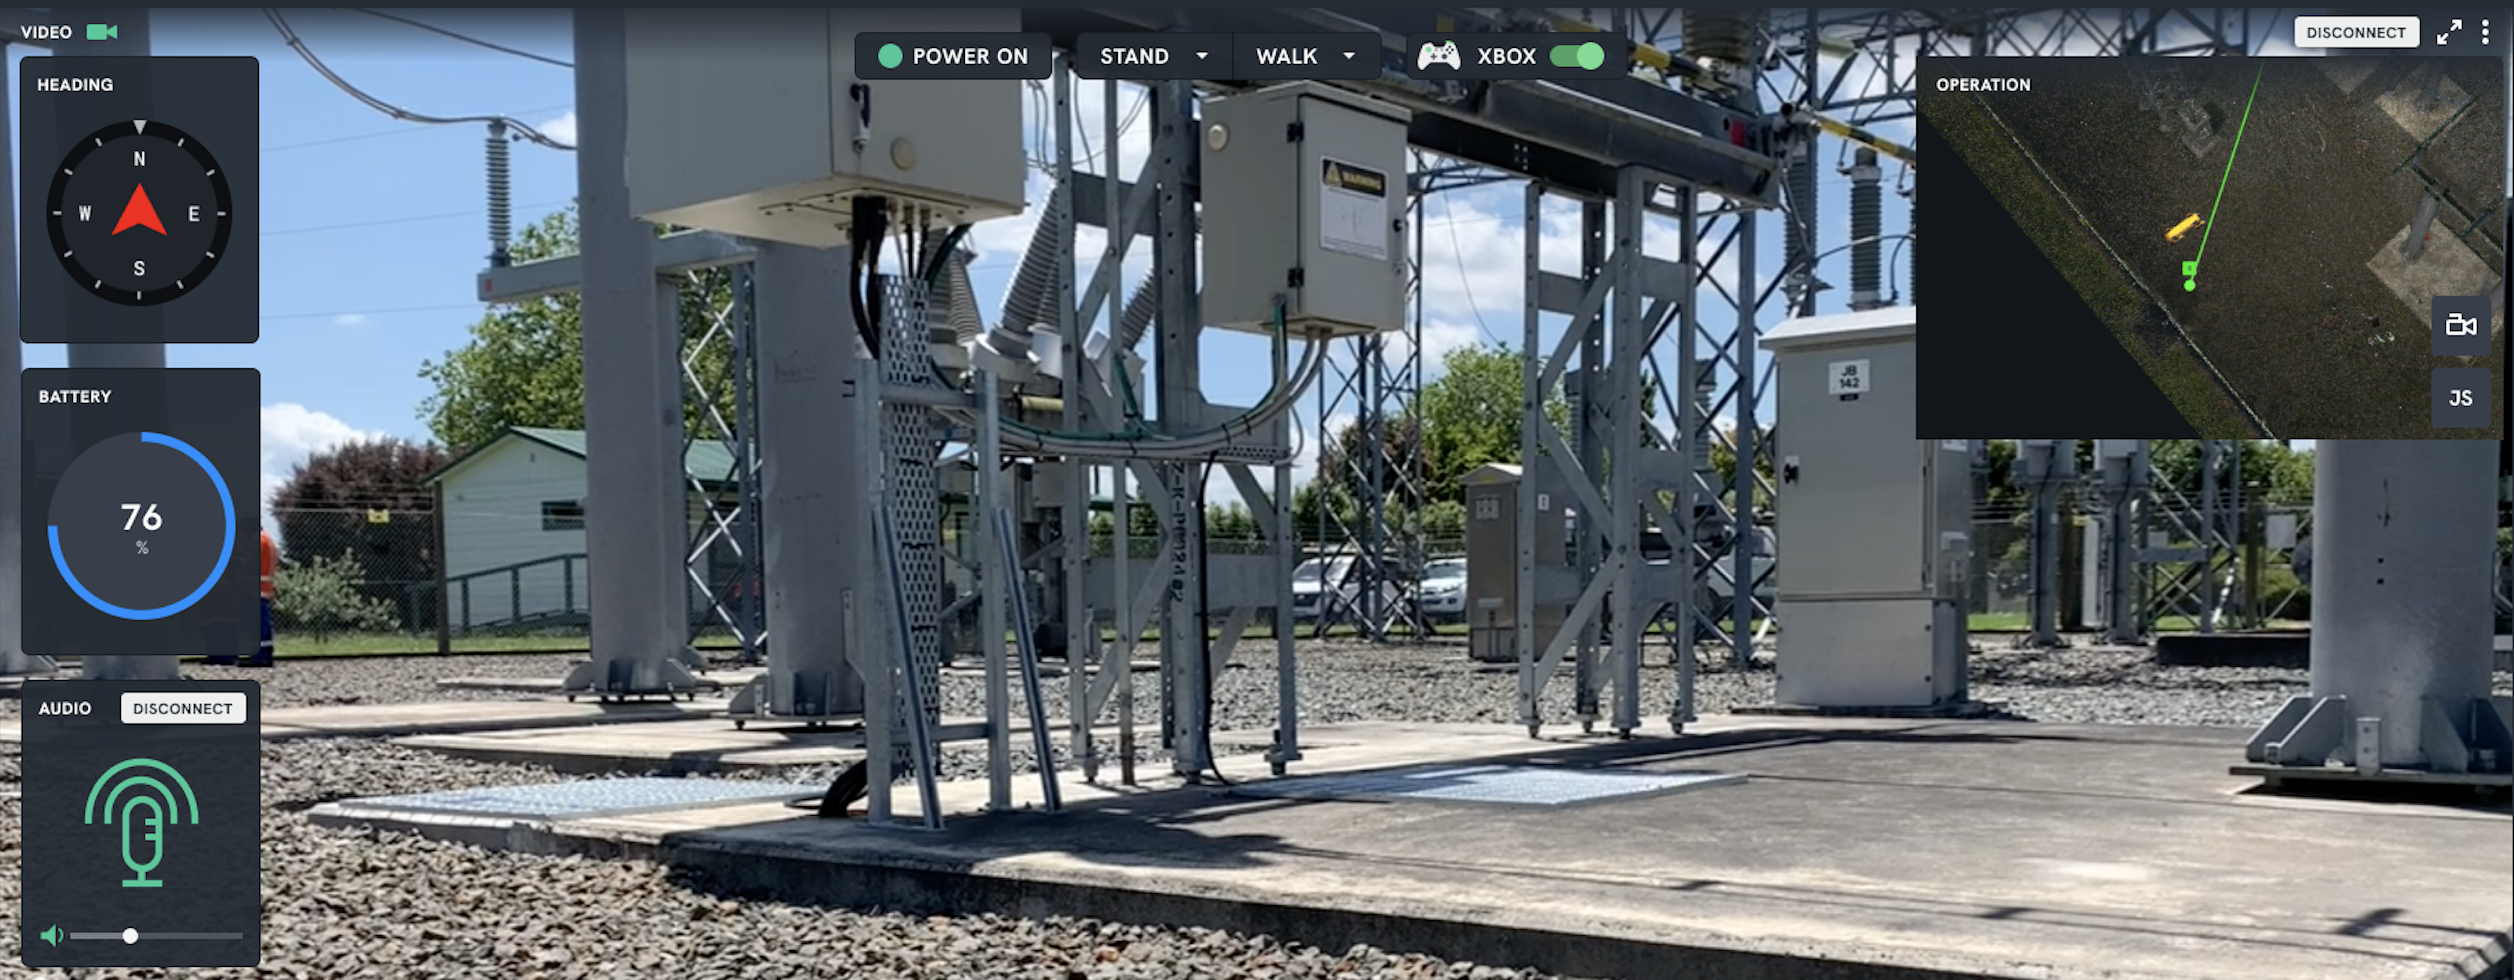
You can create multi-layer dashboards by moving a widget to the background layer. This is very helpful for creating teleoperation dashboards for example where you want to maximize the video stream or operations view and have important telemetry on top of this.
To do this you can add a new widget or edit an existing widget and click the tickbox "Place on background layer". You can also click on the three dots on a widget when in edit mode and change the layer quickly. Resize the widget to the size you require. Now you can move other widgets on top of this.
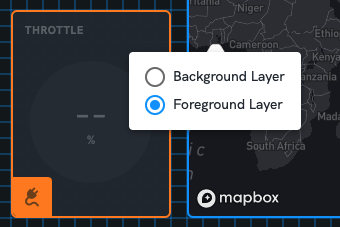
Below is an example of some overlaid widgets.
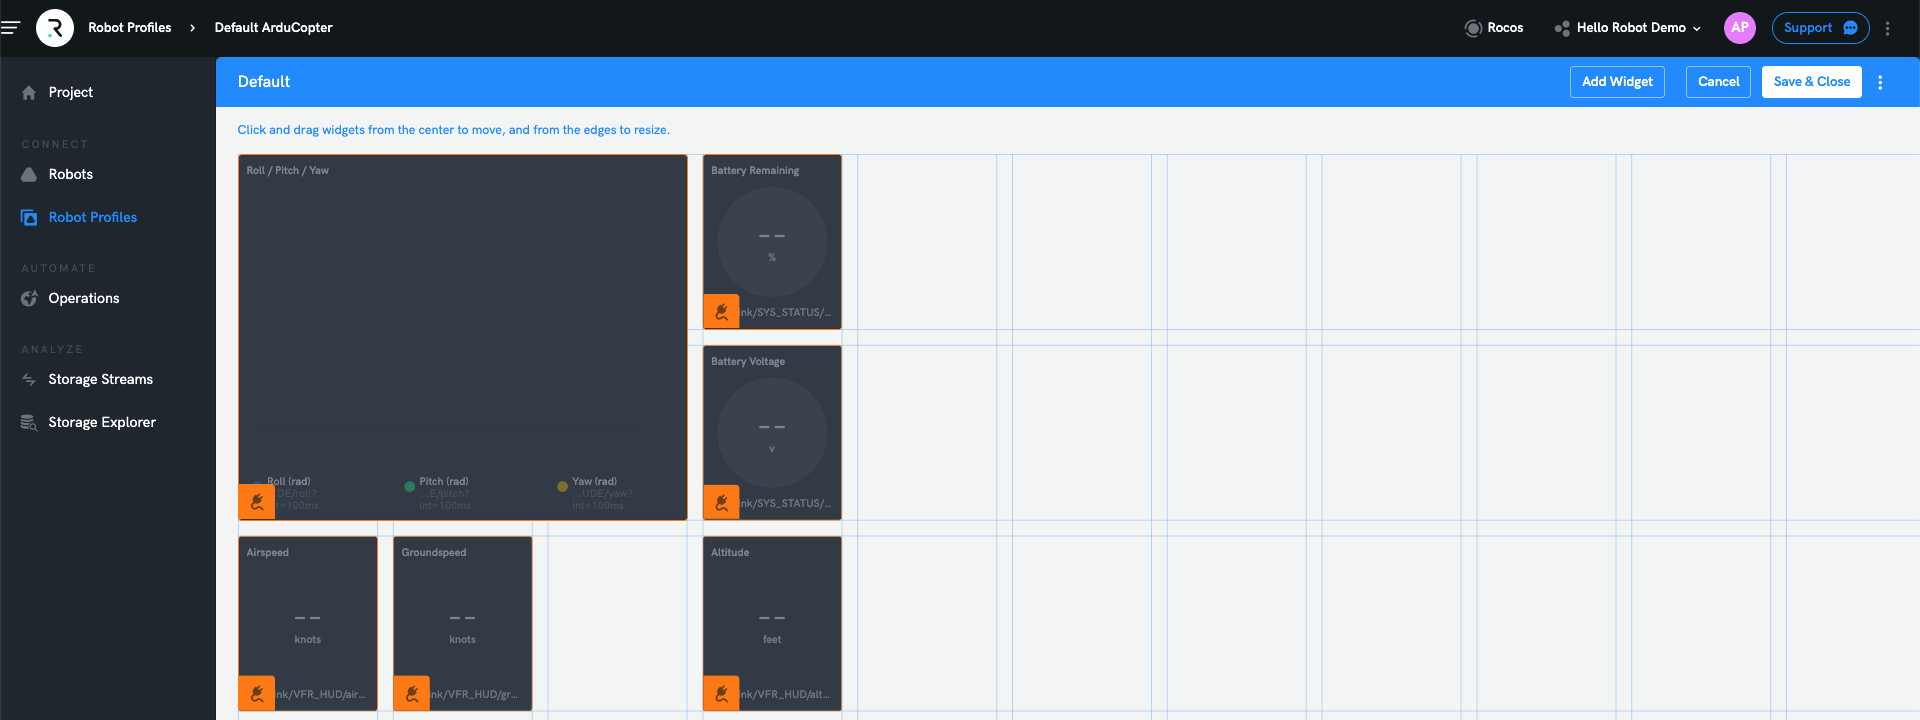
Adding a Widget
-
Click 'Add Widget' then select the widget type you want (see options below). Donut gauges are good for data that has a range for example.
-
Set the Widget Timeout. This is the amount of time (seconds) the interface will wait until alerting you that the widget hasn't received any data.
-
If you know the Data URI of the value you want to bind to the widget enter it here, or use the Data Picker to find the value you're after. See Exploring Data on your Robot and Streaming Data for more information.
-
If required, you can adjust the display value using a Value Expression. This is useful for shifting decimal places, or for converting values to percentages to be used with the Donut Gauge widget.
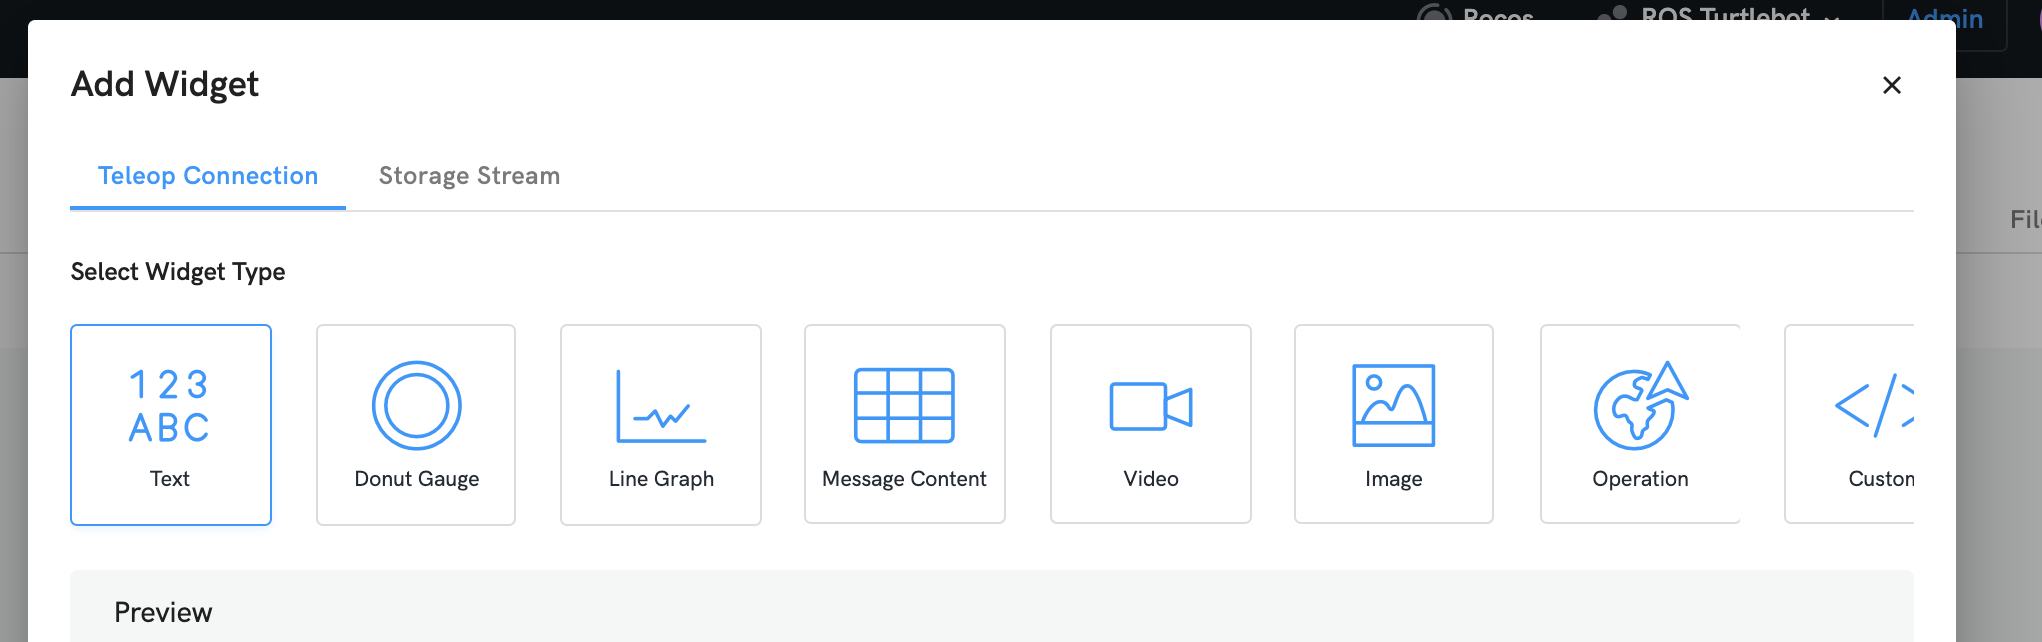
- You can then use the blue grid below to resize your widgets to your selected size.
Publishing a Dashboard
You must always publish your dashboard to push changes to your Robot or Robot Profile (All robots in that Profile).
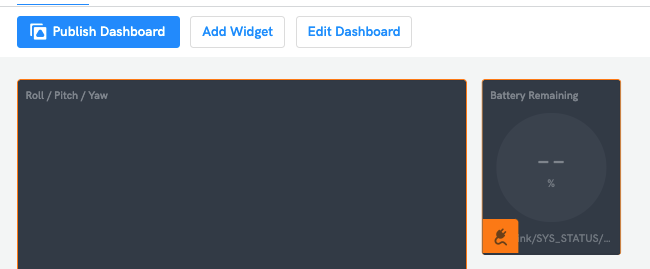
Editing a dashboard
Clicking on "Edit Dashboard" and this will put your dashboard in full screen mode to edit. Then in the top right hand corner click "Save and Close". If you have made any changes you then need to click the blue "Publish Dashboard" button to push the dashboard to the Robot or Robot Profile.